|
by Lorenzo Comolli - Written in November 2012 - Thanks to Massimo Cenedese for the camera |

In this page you'll find a technical test. Please refer here for an introduction, details and testing method.
Available sensitivities:
- standard: from 100 to 1600 ISO with 1 EV steps
- extended: 3200 ISO
-
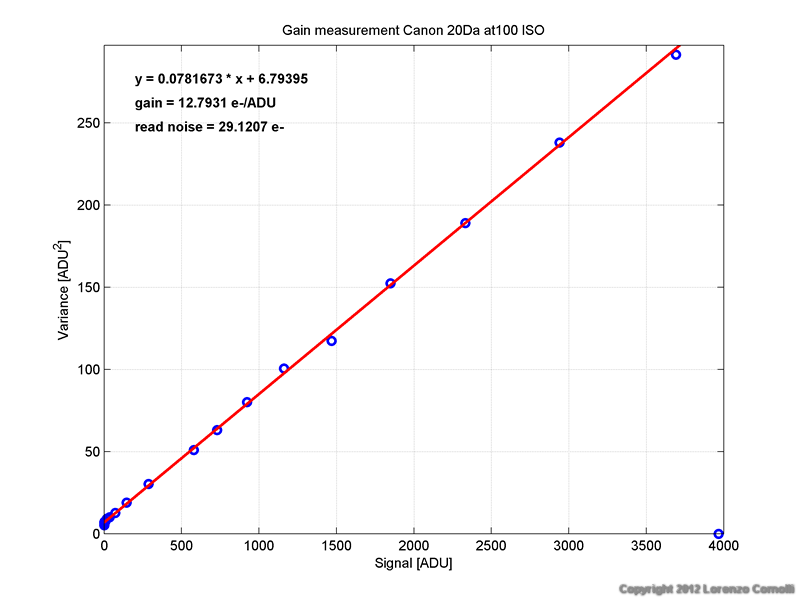
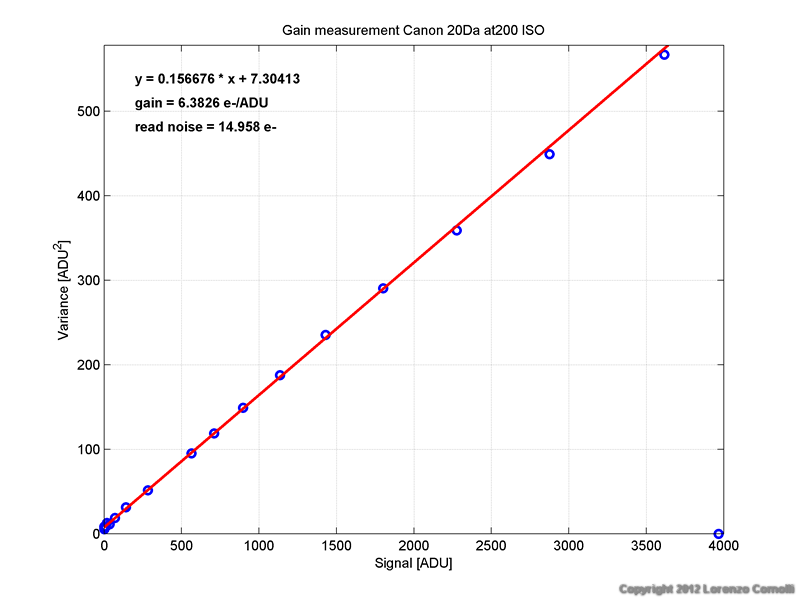
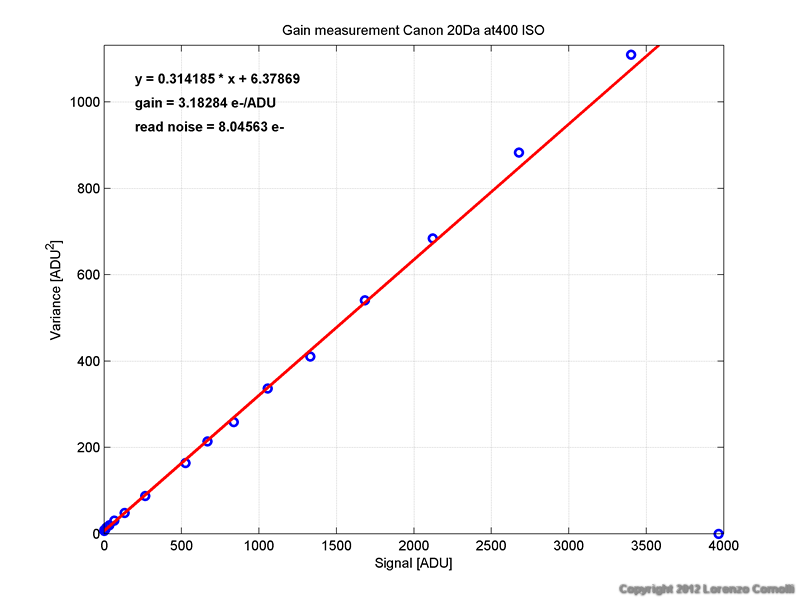
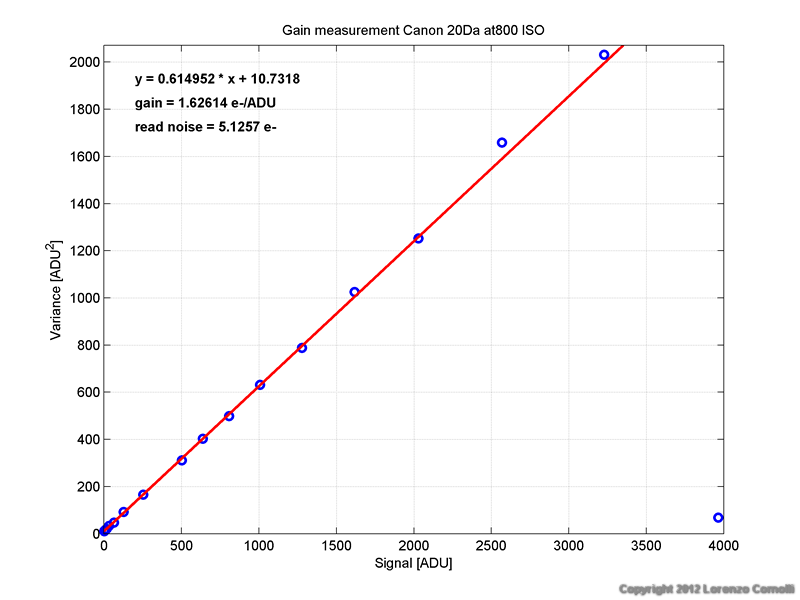
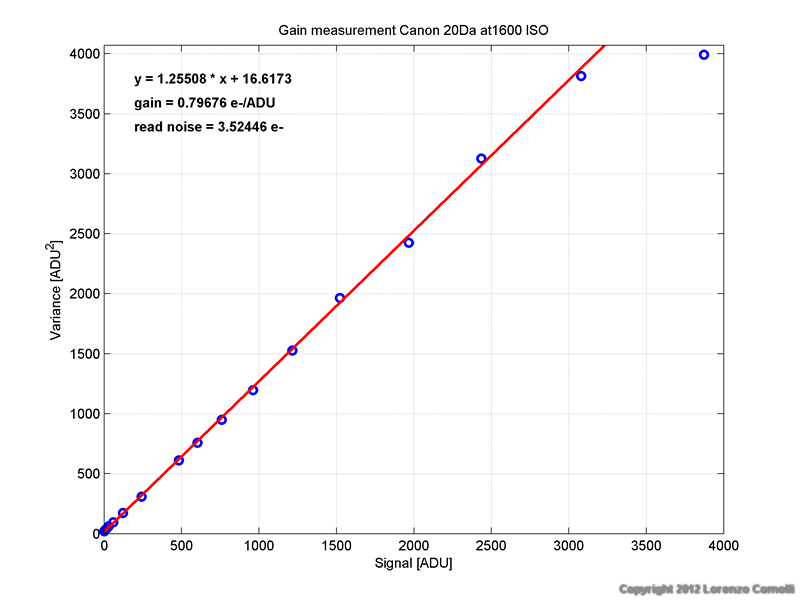
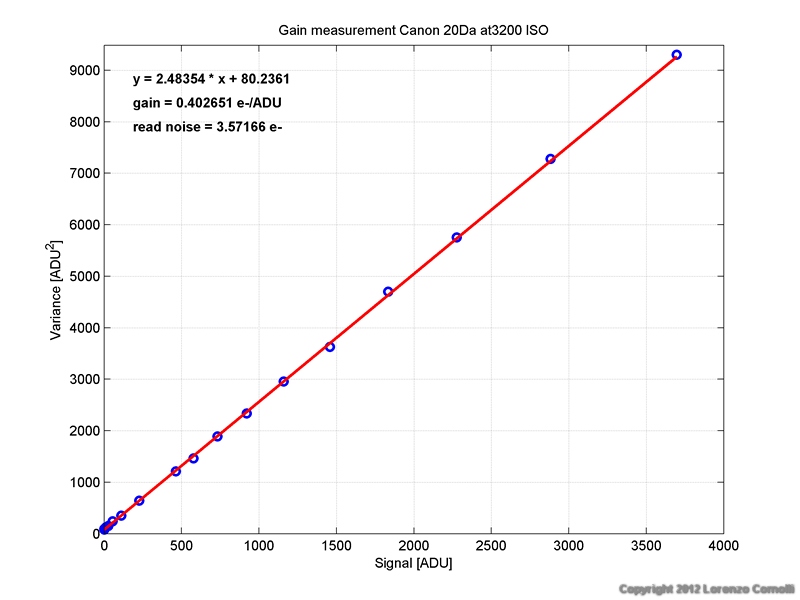
Gain. The measured gains follow accurately the power law.
- Unity gain at 1284 ISO
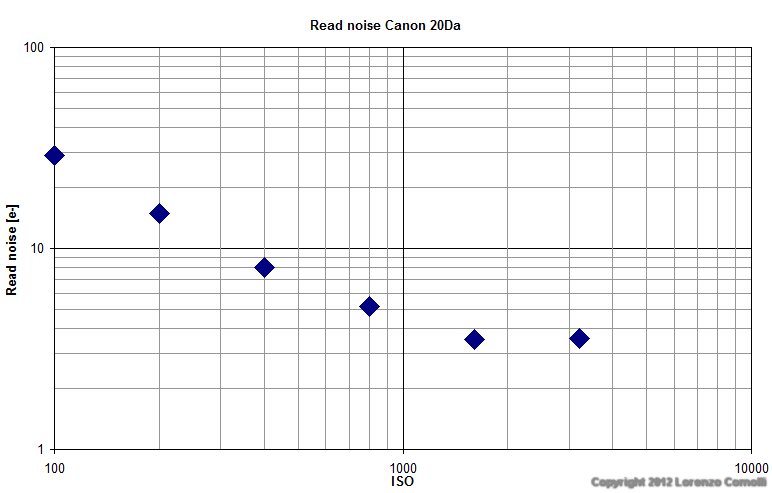
- Read noise. A constant
decrease is found up to 1600 ISO. Using 3200 ISO produces no improvement
on the read noise. The reason is clear looking at the histograms: 3200
ISO is not a true sensitivity, but it is produced by internal software. For
best results in low light circumstances, use 1600 ISO.
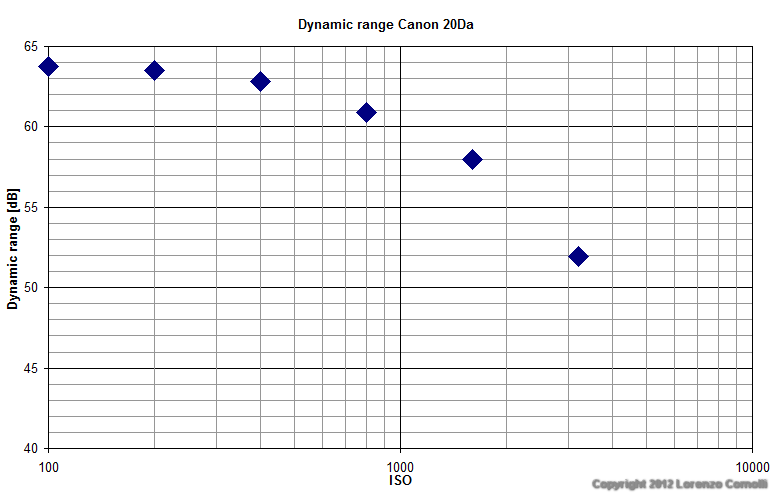
- Dynamic range. Considering
a full well capacity of 3500 ADU, the approximate dynamic range is
computed and reported both in the table and graph below. The best dynamic range
is obviously at 100 ISO, but also 200 and 400 ISO has a similar dynamic
range. Above that sensitivity the dynamic range start to decrease
noticeably. For best results on bright subjects, use 400 ISO or less.
To distinguish between true and software interpolated sensitivities, the best method is to look at the histogram of a nearly uniform image (like a flat field). The result is shown in the figure below, and the conclusion is:
- 3200 ISO is obtained
via internal software. The false sensitivity is also confirmed looking at the read noise
data: the read noise of 3200 ISO is nearly equal to 1600 ISO.
- 100, 200, 400, 800 and 1600 ISO are true.
- no intermediate sensitivities (i.e. 1/3 stop) are possible using the standard firmware.
| ISO | gain | read noise | Approx dynamic range |
| [e-/ADU] | [e-] | [dB] |
|
| 100 | 12.7931 |
29.121 | 63.7 |
| 200 | 6.3826 |
14.958 | 63.5 |
| 400 | 3.1828 |
8.046 | 62.8 |
| 800 | 1.6261 |
5.126 | 60.9 |
| 1600 | 0.7968 |
3.524 | 58.0 |
| 3200 | 0.4027 |
3.572 | 51.9 |

Histograms
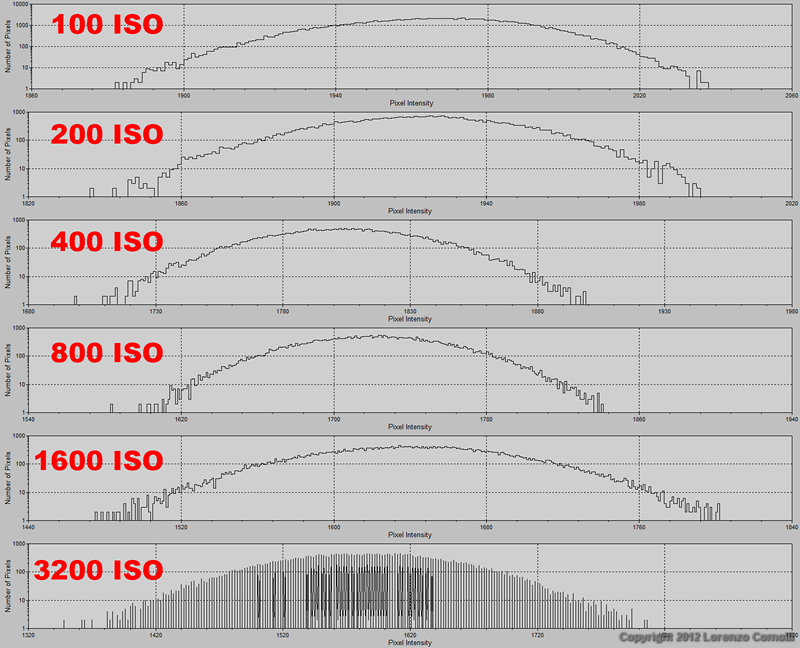
Details of measurements at each ISO setting
