|
by Lorenzo Comolli - Written in October 2012 |
Introduction
In this page you'll find a technical test. Please refer here for an introduction, details and testing method.
Available sensitivities:
To distinguish between true and software interpolated sensitivities, the best method is to look at the histogram of a nearly uniform image (like a flat field). The result is shown in the figure below, and the conclusion is:
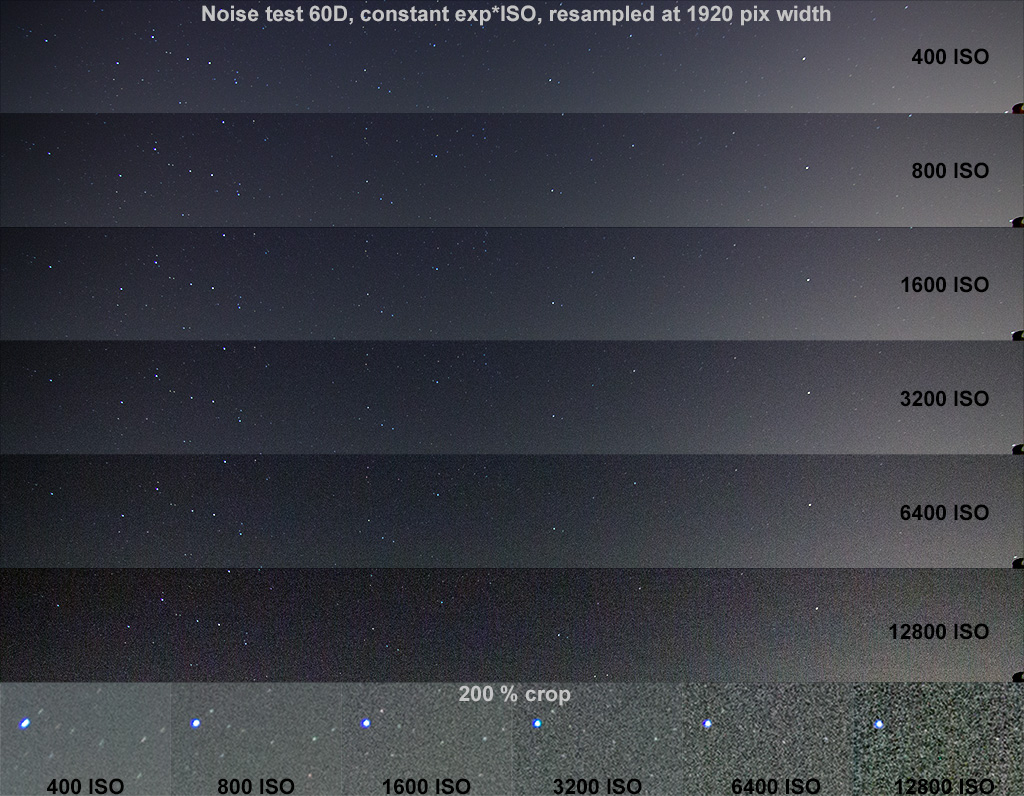
Even if my backyard is heavily light polluted (SQM 18.7 at the time of test), I've evaluated the impact of noise in the night sky imaging, with a particular focus at time-lapsing, and so resampling the images at 1920 pixel width. I've imaged a field (East, toward Pegasus) with a Tokina 11-16 mm f/2.8 lens (set at 11 mm f/2.8). I've started with 30 s at 400 ISO and then increased ISO and decreased exposure time by 1 EV steps.
The result is that up to 1600 ISO, the noise is very limited and nearly all the small stars remains visible. At 3200 ISO the noise starts to become noticeable, while above many stars start to be lost. Thus I think the best solution for night-sky time-lapsing is in the range 1600-3200 ISO range.
Gain and read noise
In this page you'll find a technical test. Please refer here for an introduction, details and testing method.
Available sensitivities:
- standard: from 100 to 6400 ISO with 1/3 EV steps
- extended: 12800 ISO
-
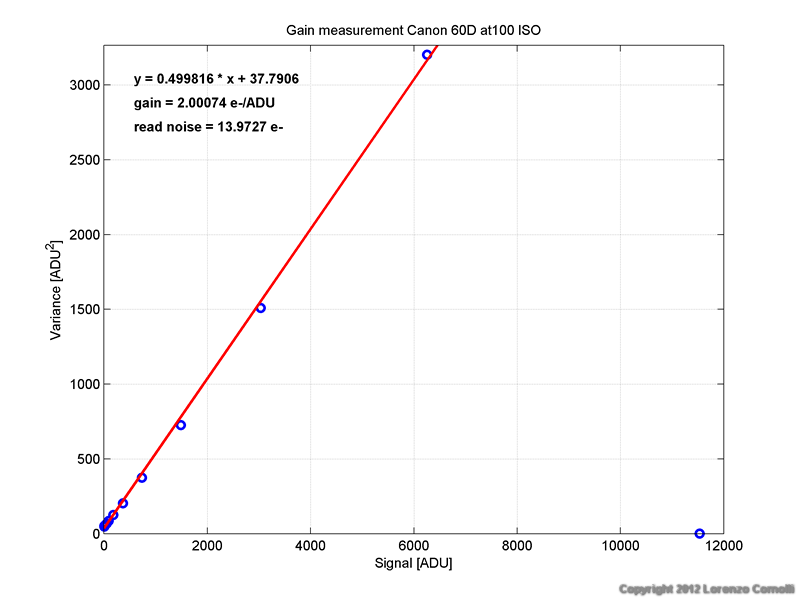
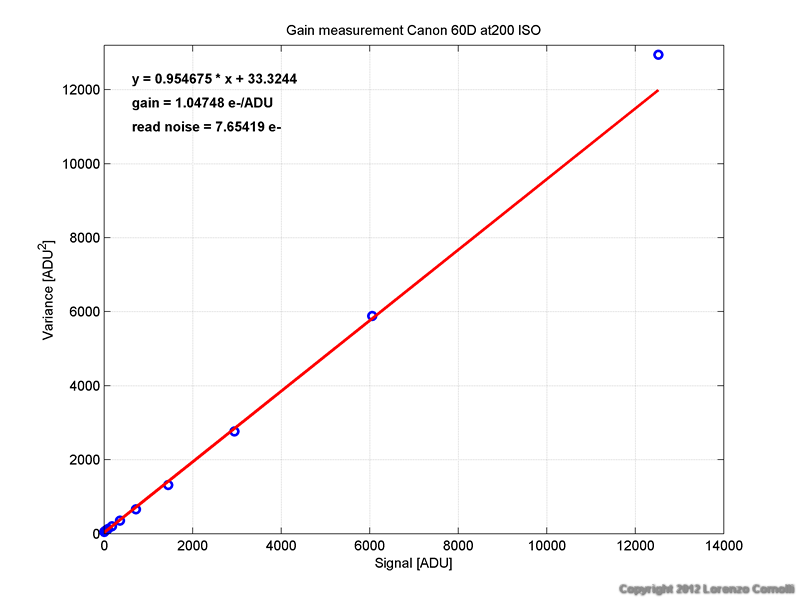
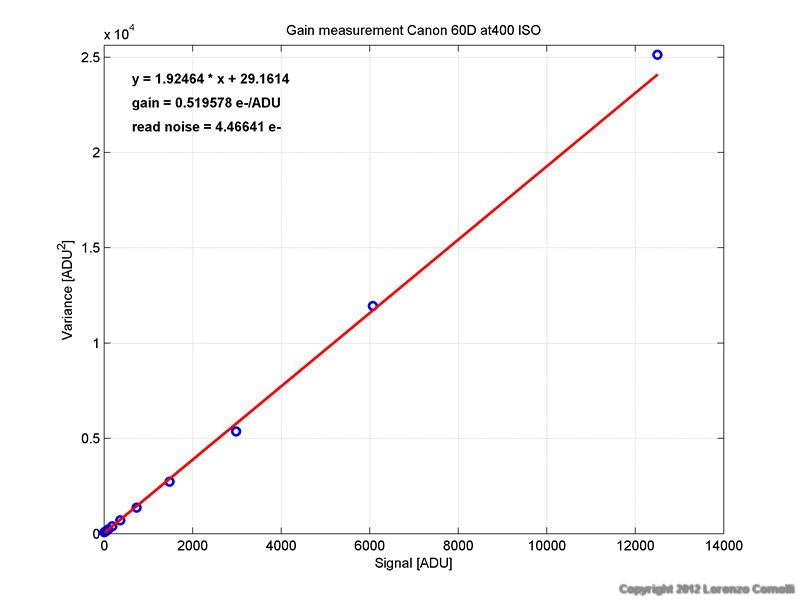
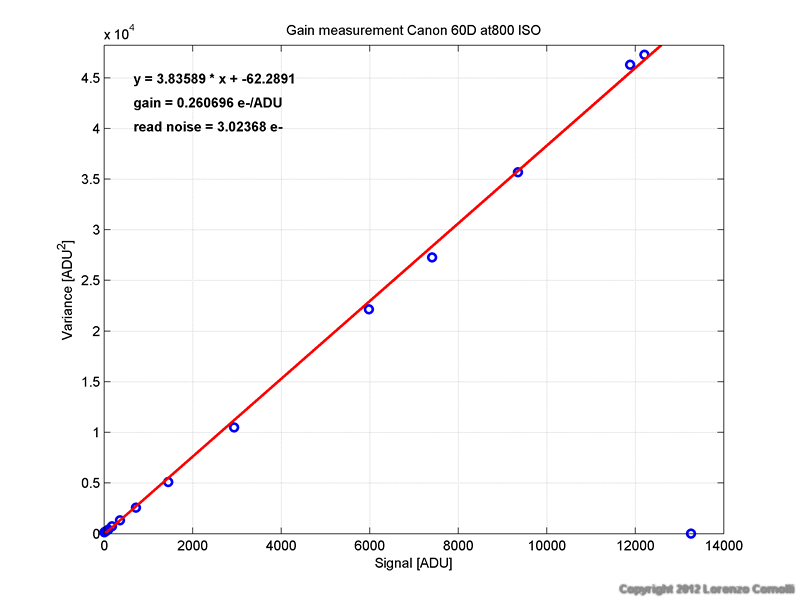
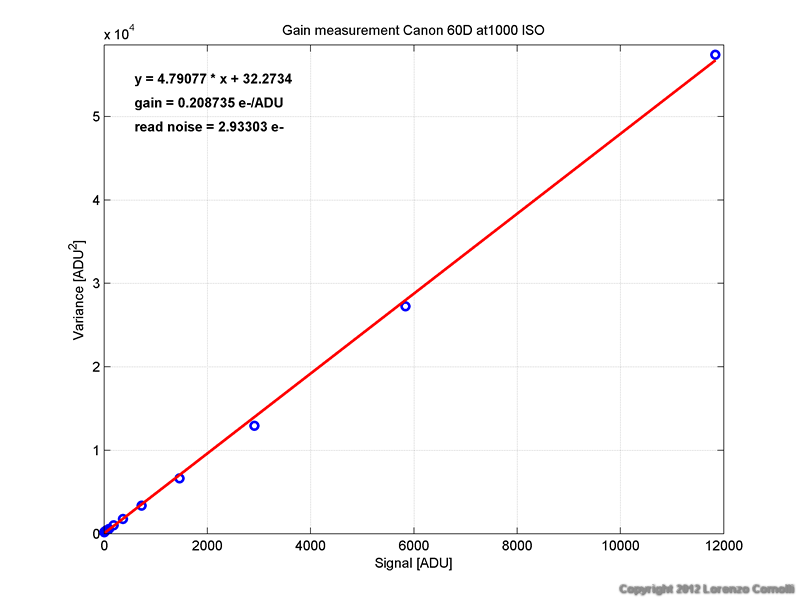
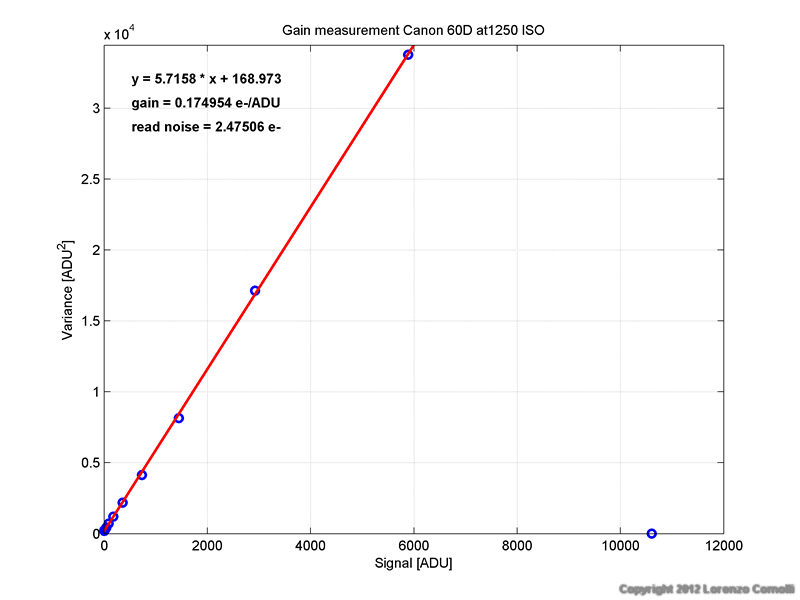
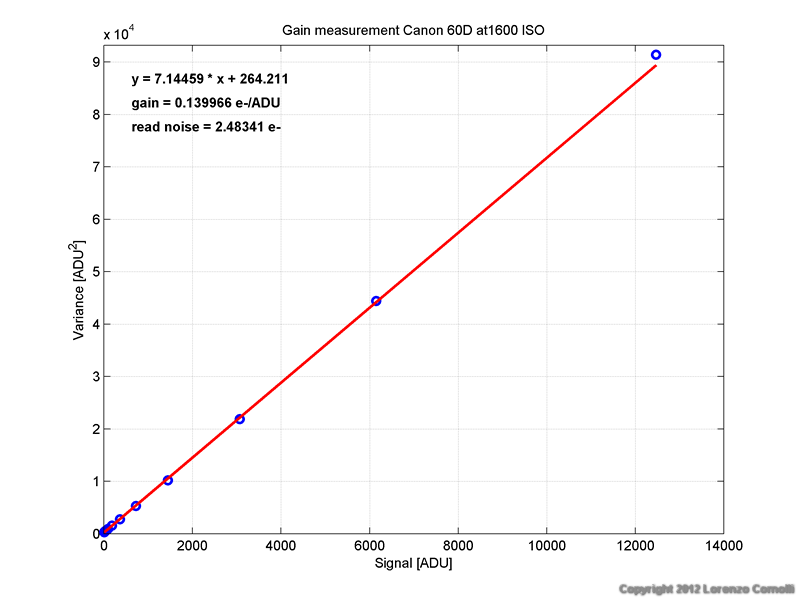
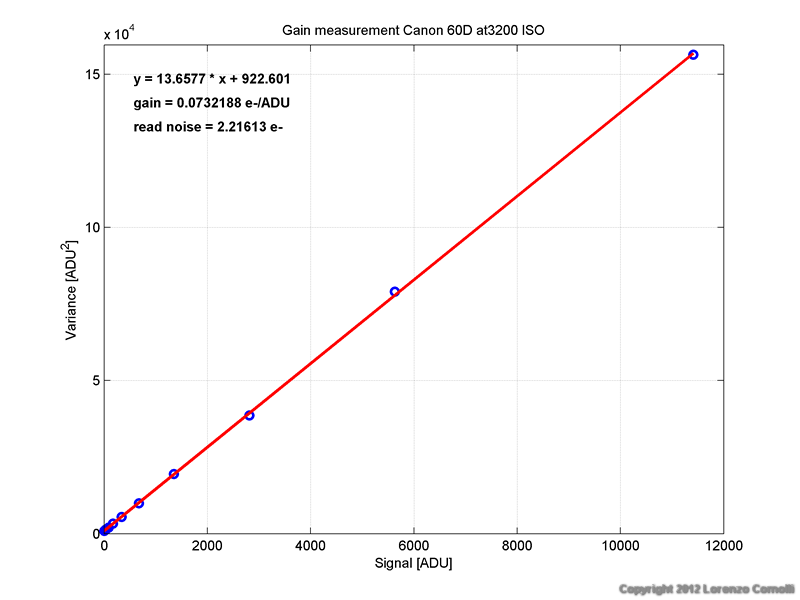
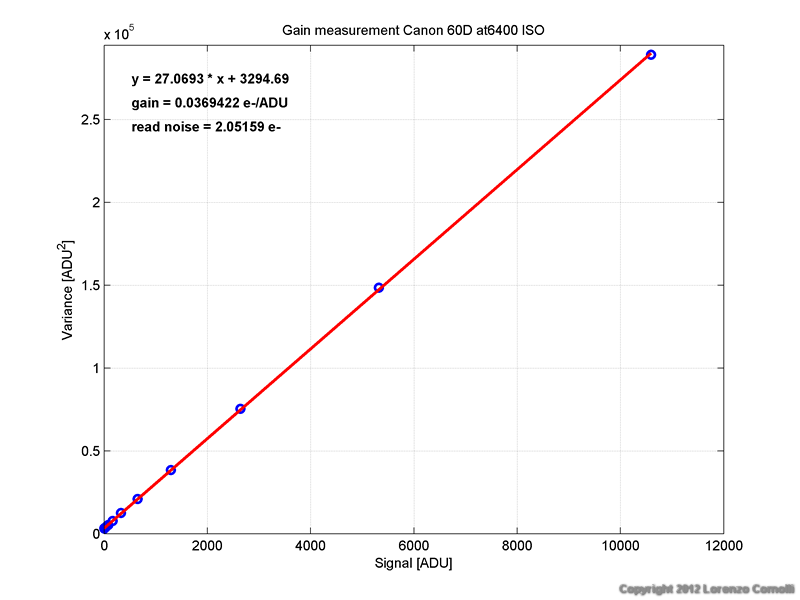
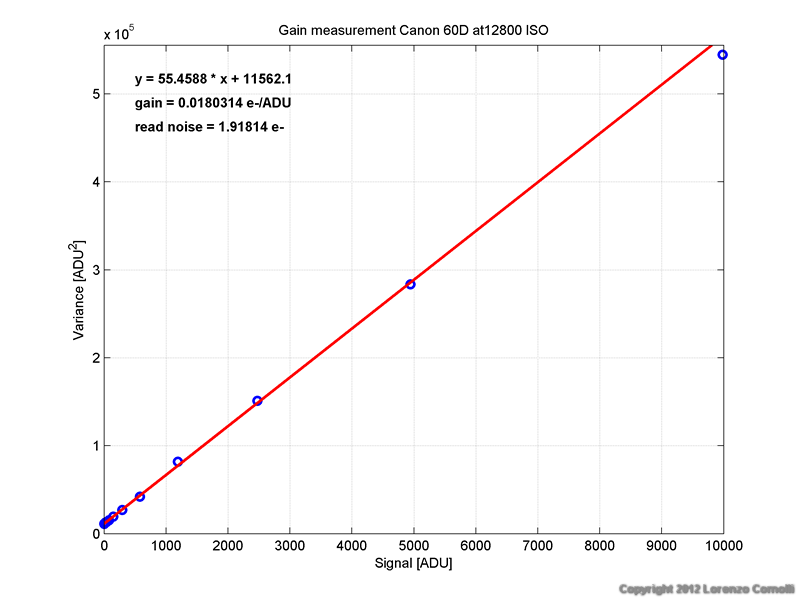
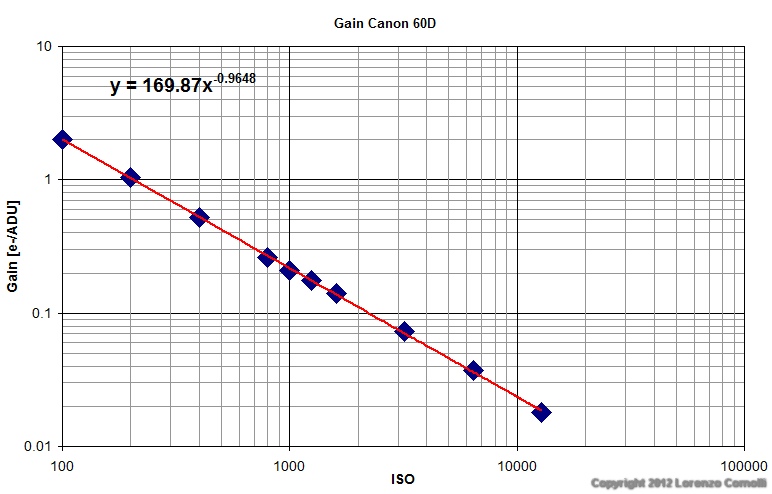
Gain. The measured gains follow quite accurately the power law.
- Unity gain at 205 ISO
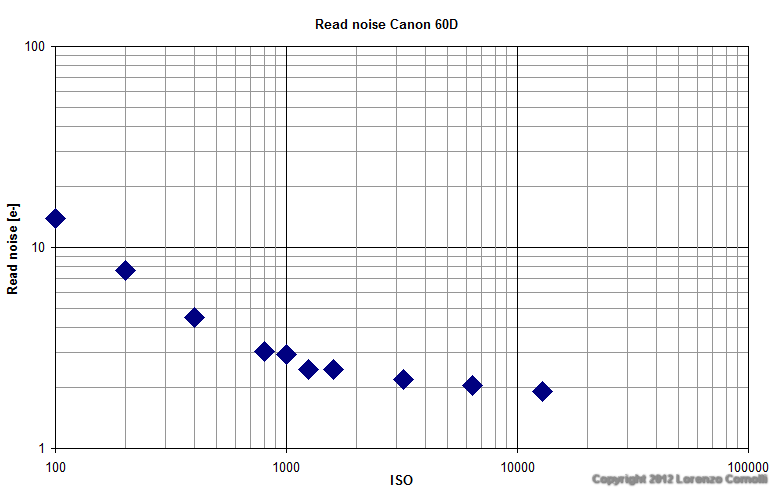
- Read noise. A constant
decrease is found up to 1600 ISO. Using 3200 ISO or more produces only minor improvements
on the read noise. Curiously, the read noise seems to not stop to decrease above 1600
ISO, but this should not as the limit of the sensor should be reached. Is this a sign of noise reduction in
the raw data at high sensitivity??? Let me know what you think. For
best results in low light circumstances, mainly use 1600 ISO, and as an extreme solution also 3200 ISO.
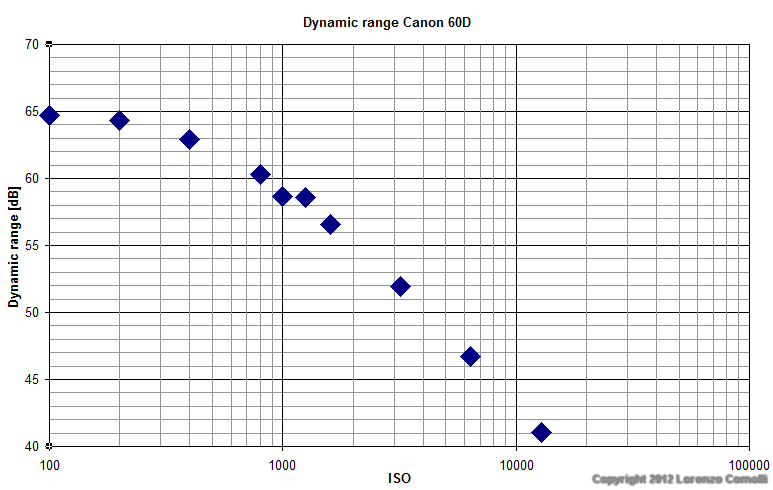
- Dynamic range. Considering
a full well capacity of 12000 ADU, the approximate dynamic range is
computed and reported both in the table and graph below. The best dynamic range
is obviously at 100 ISO, but also 200 and 400 ISO has a similar dynamic
range. Above that sensitivity the dynamic range start to decrease
noticeably. For best results on bright subjects, use 400 ISO or less.
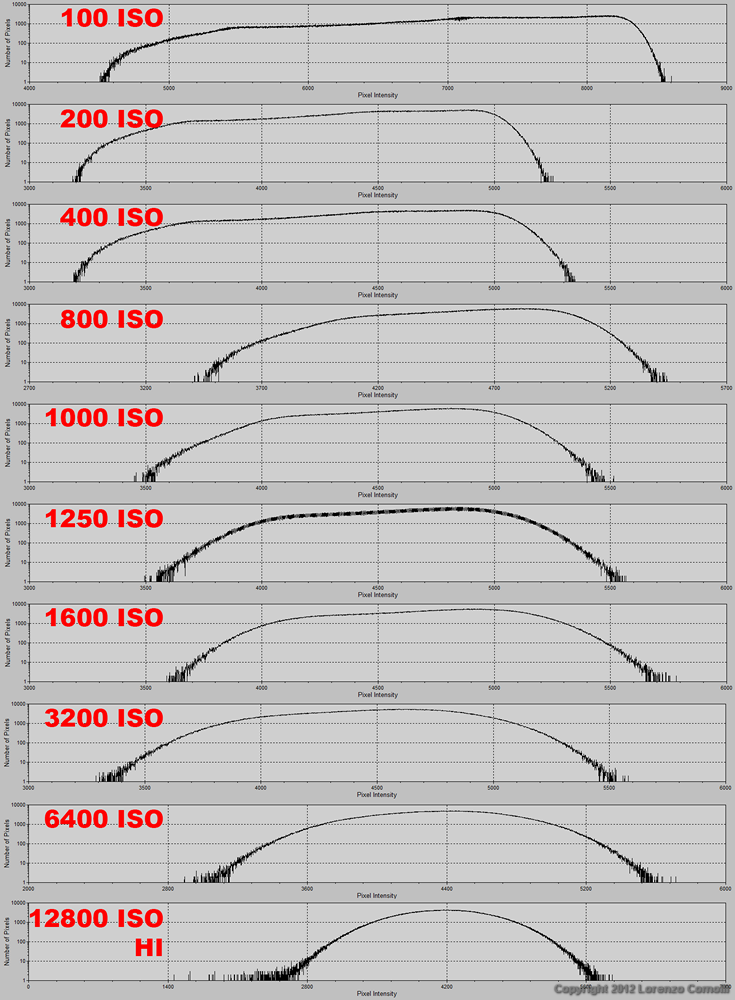
To distinguish between true and software interpolated sensitivities, the best method is to look at the histogram of a nearly uniform image (like a flat field). The result is shown in the figure below, and the conclusion is:
- 12800 ISO, extended sensitivity, seems to be true because no gap is
present in the histogram. But why Canon say this is extended? Maybe this
is really a false sensitivity, with gaps, that has been software
processed to remove noise, and this can also remove the gaps. But I've
no idea if this hypothesis is true.
- looking at the read noise
data, it seems that intermediate 1/3 step sensitivities are not
true: 1000 ISO has the same read noise of 800 ISO and 1250 ISO has the
same of 1600 ISO. But
why the histogram do not show any gap? At a careful inspection, 1250 ISO
shows something strange, with a not perfect uniform distribution of
brightness values. Maybe these are false sensitivities corrected by
internal software to show nearly no gaps in the histogram.
- 100, 200, 400, 800, 1600, 3200, 6400 ISO are true.
Even if my backyard is heavily light polluted (SQM 18.7 at the time of test), I've evaluated the impact of noise in the night sky imaging, with a particular focus at time-lapsing, and so resampling the images at 1920 pixel width. I've imaged a field (East, toward Pegasus) with a Tokina 11-16 mm f/2.8 lens (set at 11 mm f/2.8). I've started with 30 s at 400 ISO and then increased ISO and decreased exposure time by 1 EV steps.
The result is that up to 1600 ISO, the noise is very limited and nearly all the small stars remains visible. At 3200 ISO the noise starts to become noticeable, while above many stars start to be lost. Thus I think the best solution for night-sky time-lapsing is in the range 1600-3200 ISO range.
Gain and read noise
| ISO | gain | read noise | Approx dynamic range |
| [e-/ADU] | [e-] | [dB] |
|
| 100 | 2.00074 | 13.9727 | 64.7 |
| 200 | 1.04748 | 7.65419 | 64.3 |
| 400 | 0.519578 | 4.46641 | 62.9 |
| 800 | 0.260696 | 3.02368 | 60.3 |
| 1000 | 0.208735 | 2.93303 | 58.6 |
| 1250 | 0.174954 | 2.47506 | 58.6 |
| 1600 | 0.139966 | 2.48341 | 56.6 |
| 3200 | 0.073219 | 2.21613 | 52.0 |
| 6400 | 0.036942 | 2.05159 | 46.7 |
| 12800 | 0.018031 | 1.91814 | 41.0 |
Histograms
Details of measurements at each ISO setting
