|
by Lorenzo Comolli |
Note: this article deals nearly only with
environmental measurements made during the astronomical
trip in Namibia of August 2011. Look also at the photographic results here.
Any amateur astronomer knows that the night sky of Namibia
is at a top level, just as a few other locations in
the world such as the Atacama desert in Chile, the
Australian outback, or the Hawaii mountaintop. But how dark
is that dark sky? Any subjective description can be
folkloristic and nice, but it fails to objectively depict
the subject, and can be misinterpreted. Objective measurements, such as
the ones made with a SMQ-L
sensor (Sky Quality Meter with Lens), are much better.Introduction
Besides the measurements of the dark sky, climate measurements such as temperature and relative humidity can help to understand the "life" of an amateur observer under such a dark sky.
The "Namibia 2011" trip
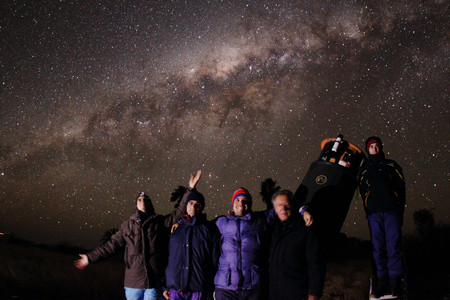
This article describes the experience that I've lived in my first trip to Namibia, with the only goal to observe and image the night sky. Four friends of mine and I (Lorenzo Comolli, Luigi Fontana, Giosuè Ghioldi, Emmanuele Sordini and Marco Cardin) moved to Tivoli Farm for ten nights under the Southern sky, from 24 August to 3 September 2011. New Moon was on 28 August 2011. For the schedule of sunset/sunrise and astronomical twilight, please refer to the graph below. For the location, this is deep winter season, corresponding to our late February. Well, from the temperatures shown in the figures below, it does not resemble to an Italian winter...
Tivoli Farm is located nearly exactly on the Tropic of Capricorn, at 23° South (website, google map). Over there the ground is completely flat and the environment is a kind of dry Savanna, on the Western edge of the Kalahari desert. The Schreiber family, owner of the farm, gave us a wonderful hospitality, and we immediately realized that our holiday was going to become a true dream.
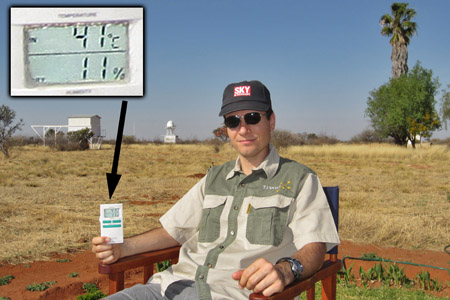
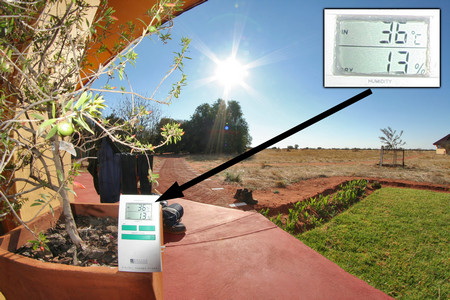

Upper raw: a couple of temperature and relative humidity measurement made during the afternoon at Tivoli Farm. Yes, this is winter!
Raw below: the "Namibia 2011" team composed of Lorenzo Comolli, Luigi Fontana, Giosuè Ghioldi, Emmanuele Sordini and Marco Cardin.
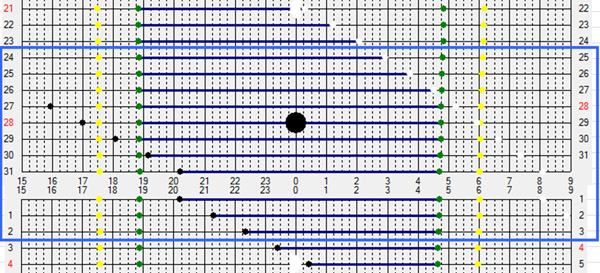
A graph showing the time for sunrise/sunset and astronomical twilight for Tivoli Farm. August and September 2011, time is local UT+1. In the blue box our stay. Generated using Perseus software.
Climate
During ten night and eleven days at Tivoli Farm we've never seen a single cloud! What can be better?
Maybe we've been quite lucky, but this is not far from the average of the season with nearly 80% of perfect days. Even if each day was identical from a Sun illumination point of view, some differences arose. The first day was quite cold, due to chilly air coming from South. But after that day, diurnal temperatures became quite similar, topping to about 35°C in the first afternoon. The relative humidity was impressively low, at least for us living in the humid and foggy Po Valley, Italy. During the day we measured an average RH of 10-15%, topping down to 9% on a particularly dry day. I had never experienced before such a single digit humidity!!! The weather forecasts were completely useless, as you can see from the example below.
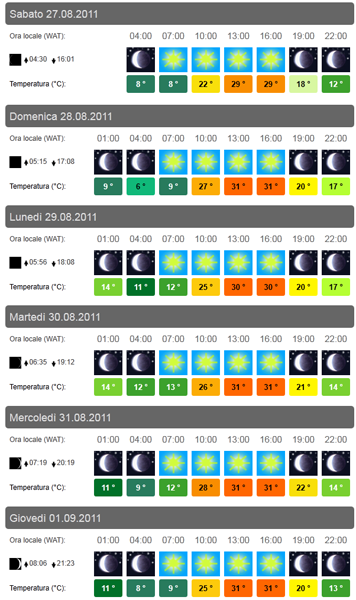
A typical forecast for Tivoli Farm: that's an easy job for meteorologists! Not a single cloud from now to the end of the long term forecast... Note that this is only a part of the story. The situation of the preceding and following weeks has been exactly the same. An unbelievable dream for an Italian amateur astronomer used to the foggy Po Valley. This is a screen shot from the MeteoBlue.ch service. Tivoli Farm is in their database!
CLICK ON THE IMAGE FOR HIRES.
The temperature gradient
During the night the temperature dropped very fast. We got minimum temperatures in the range from -1 to +9°C, with an average difference from day to night of 30°C ! This was a completely new experience for all of us, used to temperatures nearly constant during the nights of the Italian Alps and Apennines. Besides the need to be dressed with many layers of clothes as the temperature drops, the most dramatic effect happening on our instrumentation was the focus shift. A refocusing was needed every 1-2 hours, and you can clearly see a worsening of the star shapes by naked eye on the monitor, from one shot the the next! At home I never need to refocus because I've never had this kind of problems.
Moreover, we needed to remove the camera during twilight to allow the fresh air to enter the telescope tube and better cool it down. This trick allowed us to improve a little over the focusing problem.
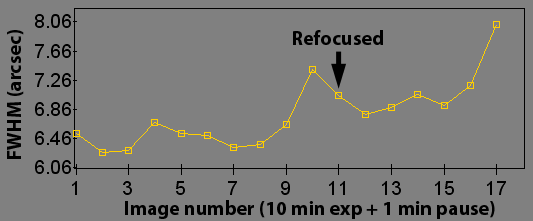
The FWHM worsened as the temperature dropped. Images from Pentax 75 and Canon 5D (scale 3.38"/pix), while imaging Antares at zenith. After the worsening of image 10, a refocusing was done, but image 17 was again de-focused, a little more than after an hour.
Temperature and relative humidity during the night
I've recorded the environmental data during each night at about 2-3 hours intervals and the resulting graphs are shown here below. From the RH measurements you understand why I felt like a stupid to have carried with me many dew remover strips.
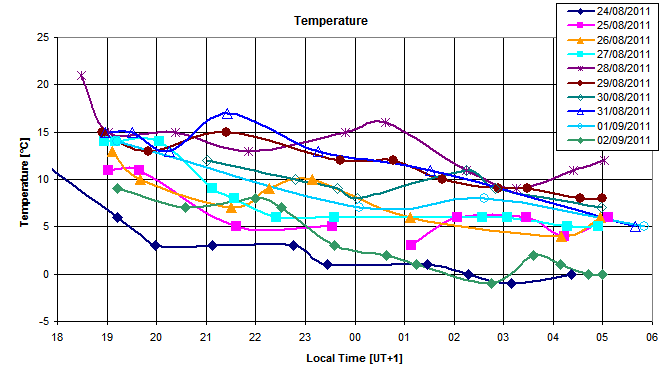
Not each night was equal. The first one was the coldest and, together with the last one, it reached freezing temperatures.
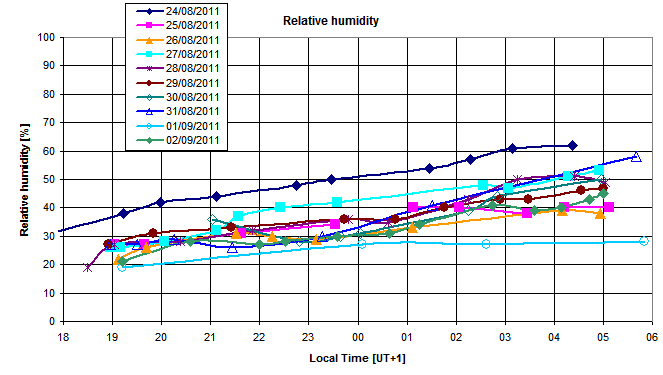
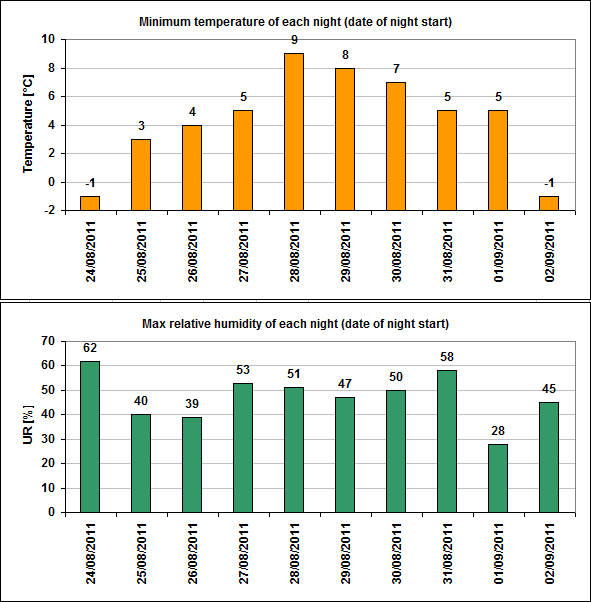
Minimum temperature and
maximum RH during each of the ten nights.
Dark Sky
The dark sky of Namibia is not simply a night sky, it's an experience! Any tourist visiting Namibia and spending at least a night in the desert is amazed by that sky. You can read dozens of reports of "standard" people that were shocked by this show.
Each amateur astronomer should observe such a night sky at least once in a lifetime. Please consider this: I've a quite large experience of observing from very dark locations in the Alps and I can testify that Namibian sky is completely another matter. That's a huge step forward. Not only for the darkness at zenith, but also for the completely dark and transparent horizon. I simply wish you to have a trip under a similar dark sky. Your conception of dark sky will be completely redefined.
SQM measurements
To get an objective measurement of how dark was the dark sky, I've used a SQM-L device from UniHedron. The measurements were gathered in the darkest part of the sky and many trials were made each time to get the most reliable measurement. The most impressive value is definitely the 22.20 mag/arcsec^2 value we got on the night of 29-30 August 2011 at about 3 a.m. That's a value largely higher respect even to my best hope.
Just consider that my best night before was a 21.84 at Colle dell'Agnello, 2700 m altitude in the Italian Alps, in 2010. Standard values for this site range from 21.5 to 21.6. The worser night in Namibia, the first, was "only" 21.75, nearly equal to my best night before. Every other night was largely better.
A clear trend is noticeable in the graph. The darkness increase in the second part of the night. This is mainly due to the Milky Way going down from the zenith. At 3 a.m. the MW contribution was at minimum, being the Southern galactic pole at zenith.
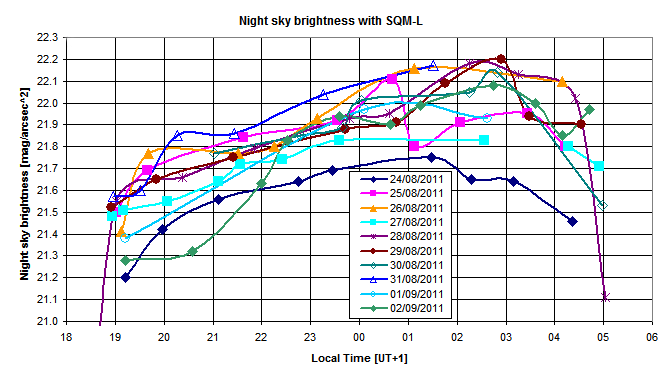
The SQM-L measurements.
Not each night was equal. The first one was the the
worst.
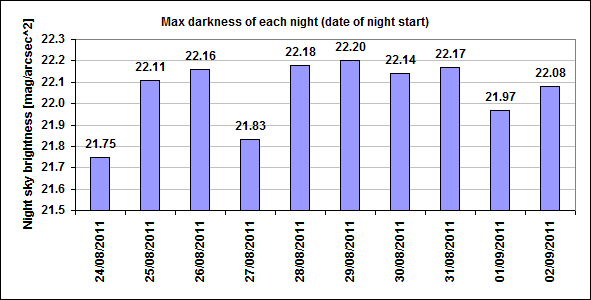
Maximum darkness during
each of the 10 nights. Only 3 of 10 nights have not
exceeded 22.0 mag/arcsec^2.
Why all the nights where not equally dark?
That's a good question and I've no good reply. If you've any idea, please write me. From a naked eye point of view, each night was equally dark, without clouds, veils or whatever. Also the many timelapses confirm that no disturbance was present.
While I've no clear answer, I can try to guess some possible reason.
- Humidity: the first night was noticeable brighter
respect the other, and also relative humidity was
higher. Maybe also in the higher layers of atmosphere
the humidity was high, and a better reflection of the
distant lights of Windhoek was obtained. But also the
fourth night was bright, while the RH on the ground was
low. And the seventh night was relatively humid, but the
sky was really dark.
- Auroral activity: a well known source of natural
brightness is the airglow of the Oxigen layer at 90 km
altitude, excited by the solar wind particles, and
emitting mainly at 558 nm (green-yellow). This glow is
particularly noticeable in the night shots made by
astronauts on the ISS. I've tried to test the
relationship between the measured brightness and the
auroral activity, looking at the NOAA POES satellite
data, but no clear correlation is found, as the figure
below shows.
- Moon light: especially first and second night, the
Moon was rising early in the last part of the night and
so it was preventing me to gain the best from the sky,
when the MW was low.
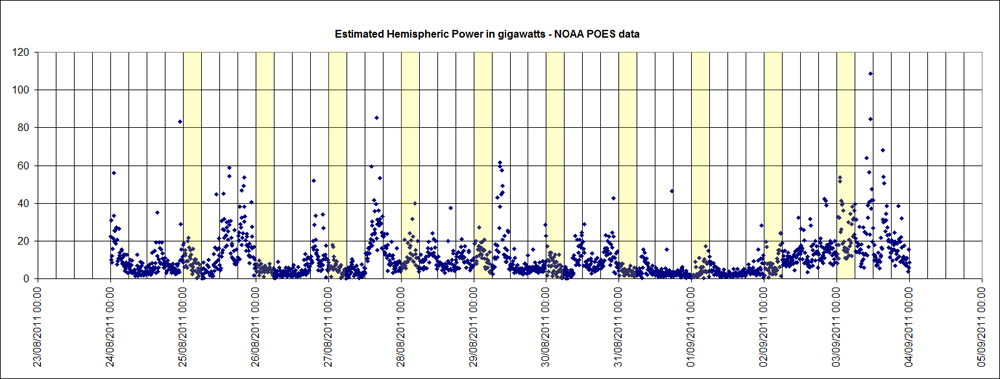
The auroral activity can be found from the data of NOAA POES satellite data. The evidenced yellow bands correspond to the 2nd part of each of my 10 nights in Namibia. No clear correlation between these data and the night sky brightness above can be found.
How dark is the horizon?
The darkness at zenith is impressive. Even more impressive in the darkness on the horizon. No light pollution is present in this location, down to zero altitude. No obstruction from mountains was present and so no possible light pollution can be hided. The lights of the capital, Windhoek, at about 130 km toward NW, are the only exception. A very small cap of light was noticed, nearly 10° wide and 3° high. It's superficial brightness was by far lower respect to Milky Way or zodiacal light. Moreover this light cap was visible only during 3 of 10 nights, when the air was exceptionally transparent. In the other nights the transparency on the horizon was "only" great and the cap was completely invisible. So the influence of this light cap on observations and images is simply zero. That's a dream for each amateur astronomer!
To get a quantitative measurement of the brightness down to the horizon I've made readings at 90°, 60°, 30°, 10° and 0°. Note that the field of view of SQM-L is +/-10°, so the 0° reading include part of the dark horizon. The worst measurement at 10° was 21.63, while at zenith it was 22.05, not particularly dark for the standard of this location. This measurement was done at 3 UT, when no Milky Way was in the sky (South galactic pole at zenith). Another measurement at nadir, toward the ground, was 23.23.
These values fit very well with theoretical models including the airmass increase, that predict an increase of about 0.4 in red band from zenith to 30° altitude (airmass 1 to 2). Refer, for this topic and much more, to F. Patat, Night sky brightness during sunspot maximum at Paranal, The Messenger, ESO 2004.
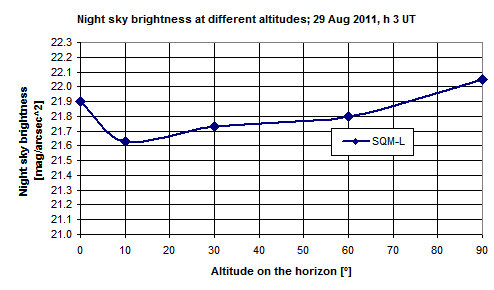
Brightness as a function of
the altitude on the horizon. 29 Aug 2011, h3 UT.
SQM-LE installation
A few days before our departure from Italy, I was contacted by Massimo Alessandria (SQM Network) for a possible ride of an SQM-LE sensor for Tivoli Farm. I was obviously happy to contribute to expand this network and I offered also for help in configuring the network during spare time. SQM-Network is an Italian non-profit organization, part of GADS association, based in Brescia, Italy. Its main aim is to collect measurements of the sky brightness using SQM-LE sensors all over the world. I contribute myself with a sensor in my home observatory (see "meteo" page). Installing such a sensor in the middle of nowhere can be tricky. Thanks to the help of Massimo Alessandria in Italy and to Emmanuele Sordini at Tivoli, we've been able to get it work. Now you can look at real time measurements on the SQM-Network website, click here for direct link. Be aware that looking at these values may have side effects...
Installation was not easy, being the nearest electronics store at 170 km drive... but Reinhold provided a long ethernet cable and manufactured a long power supply cable. The box was placed right above the library, so that it can be connected to the local area network, and so also to the internet. Yes, internet in the middle of the savanna! Reinhold has a microwave radio link with good speed.
But the hardest part was the configuration. We needed to understand how to configure the router, that showed a strange behaviour. Moreover during configuration, internet suddenly went down and we lost a lot of time trying to figure out if this was our fault. Fortunately for us the problem was on the internet provider side and the link was reestablished the next day.
The last night we were able to get real time measurements both from the SQM-LE sensor and from out hand-held SQM-L. A comparison of that entire night is here below, together with photos of the installation.
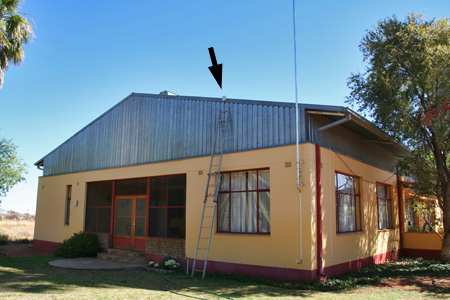
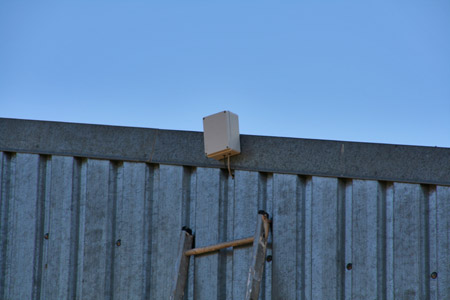
The SQM-LE was installed by Reinhold above the library.
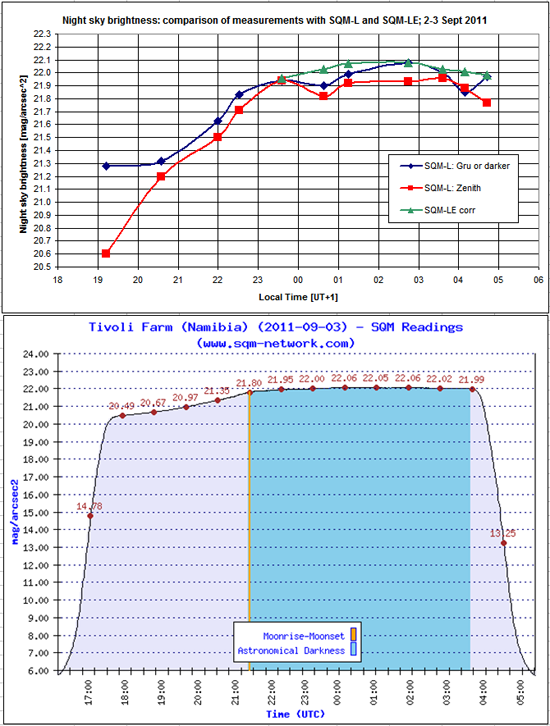
Above: a comparison between the fixed SQM-LE and the hand-held SQM-L; the readings were made gathering the numbers via the SQM-Reader software. Yes, my PC was gathering images from my Canon 5D, and was connected wireless to the internet, under such a great sky!
Below: the data was collected remotely also from the SQM-Network, that produced this graph. The comparison shows very similar values.
SQM measurements are only single point measurements. It would be interesting to look at the brightness distribution all over the sky, but no commercial instrument is available with this feature. Nevertheless an All-Sky image can be calibrated to get such a result. We've gathered such images with a Canon 5D and a Peleng 8 mm lens, obtaining these results: with and without Milky Way. Calibration was conducted using the SQM reading as a reference. Being the digital sensor of a DSLR linear, the values all over the sky can be obtained. I've produced the next images using Matlab and a custom made script.
The images show three situations:
- Namibia, Milky Way at
zenith. This was for us at the start of the
night. So at the same time zodiacal light was present on
the West horizon. Nearly no area is free of "pollution"
from MW or ZL!!! The darkest area is 21.7.
- Namibia, Milky Wat on
the horizon. This was for us at about 3 a.m.
local time. The only "pollution" is due to zodiacal band
and gegenschein. The darkest part of the sky is 22.15.
This is not the darkest night we got, but quite close.
- Colle dell'Agnello,
Italy, Milky Way at zenith. This location at
2700 m altitude in the Alps is the best one I've
experienced in my life, before Namibia. The image was
taken during an extremely dark night for the Italian
standards. Even if most of the horizon is covered due to
nearby mountains, the sky below 30° is light
polluted. This was quite a dark night for the location,
at 21.5. I've no comparison from Italy without MW
because this image was intended just to image MW!
- Galactic center
(first image). The center of MW measures 20.6, while
brightest parts of Cygnus are 21.2 and Crux is 21.0.
Southern MW is brighter!
- Zodiacal light (first
image). The brightness was impressive by naked eye. The
first night I was threatened! The brightest part is
20.9, so it is brighter respect to Cygnus MW and only a
little dimmer respect to MW bulge.
- Zodiacal band
(second image). The zodiacal band clearly split the sky
in two darker areas. The darkest part of the zodiacal
band is 21.90, that is 0.25 brighter respect to other
areas at similar altitudes. That's why you need a truly
dark sky to see the ZB.
- Gegenschein (second image). The brightness is a little higher respect to ZB, brightness is 21.70, that is 0.45 more respect to the other areas at the same altitude. That's relatively easy to see from Namibia, but from Italy I've observed it only a single time, and it was a hard job.
- Namibian horizon (second image). The horizon is incredibly dark. Excluding the regions polluted by MW and ZL &C, the brightest part of the sky is at about 10° altitude, at 21.7-21.8. In Italy such a value at zenith can be considered a very uncommon and exceptional night, that can be obtained from only a few remote locations on mountaintops and in a few days when the light pollution from the cities is hidden by the fog. At altitudes lower than 10° the sky is darker because of atmospheric extinction.
- Italian horizon
(third image). At the altitude of 10°, the sky of
Colle dell'Agnello shows 20.7, in the darkest region
(SE, toward mountains), and 20.0 in the most polluted
region (NW, toward Torino, about 1 million inhabitants,
70 km distance). The darkest area of the sky, at 21.5,
is brighter respect to the Namibian horizon... no
comment.
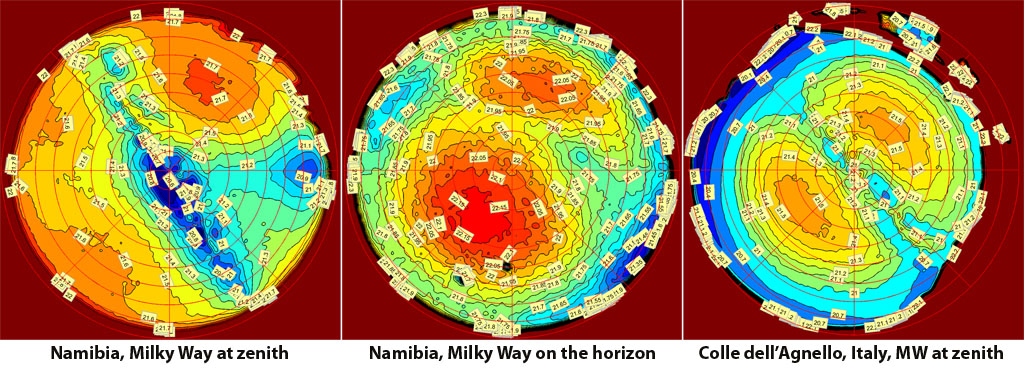
All-Sky maps of the night sky brightness. Blue is brighter, red is darker. Labels in the hires shows the values in mag/arcsec^2. North a top.
CLICK ON THE IMAGE FOR THE HIRES VERSION.
At the end of this article I feel two sentiments, that also you may feel: first I would immediately be teletransported to Namibia, and second I feel sad for our "bright dark" sky. I hope in this page to have given an idea of the environment of the Namibian sky at Tivoli Farm, both from a temperature/humidity point of view, and for the night sky brightness.
I frequently hear descriptions of "truly" dark skies, but now I think that any description is void if you've never observed a "really true" dark sky like the one I got in Namibia. The problem is that even experienced observers, but observing only from good Italian skies, can testify that a particular night was very dark. In a case I was present under the same sky of such a claim, and I've measured 21.2, a full magnitude per square arcsecond brighter respect to my Namibia! That's a really huge difference. The same difference experienced from a moderately polluted sky of a small city in the Po Valley (like the subhurbs of Varese, Italy) and the supposed dark sky in the Apennines. Two lessons: don't trust in any desciption, require objective measurements; and let's go to see again that dark sky!
Acknowledgments: I'd like to thank my friends Luigi Fontana, Giosuè Ghioldi, Emmanuele Sordini and Marco Cardin for sharing this great experience. Thanks also to Marco Cianci for addressing me the paper by F. Patat. And again thanks to Marco Cardin for help in reviewing my bad English.